
Devices
Product Architecture
The structure behind the SPEEDDHI™ ecosystem.
Operation Technologies
Operation Technologies
SmartPlan™Donor Mapping™ExtractCount™MultiPen™LiveCount™SmartTrack™SmartReport™Connected Services
Connected Services
Patient Display™Cloud Portal™RemoteCare™Operation Journey
One operation. Connected technologies.
Every device and software module in the SPEEDDHI™ ecosystem supports a different stage of the operation.
01 — Plan
Define the target before the operation begins.
SmartPlan™ + Donor Mapping™
Implantation zones are created on patient photography. Each zone can be evaluated by area, target density, and planned graft count. The donor area can also be assessed to prepare an extraction strategy before the operation.
GraftPlanner screenshot
FRONTAL ZONE42 cm²35 graft/cm²1,470 grafts planned
02 — Extract
Track extracted grafts from the first stage.
SPEEDDHI Extract™ + ExtractCount™
SPEEDDHI Extract™ is an intelligent micromotor platform that detects extraction activity during FUE and transfers count data into the digital operation workflow.
SPEEDDHI Extract™ render area
2,845GRAFTS EXTRACTED
03 — Transfer
Keep graft flow organized and uninterrupted.
SPEEDDHI Core™ / SPEEDDHI XL™
Prepared implanters are loaded into the SPEEDDHI system. The platform supports transfer between teams and helps graft movement continue in a structured rhythm throughout the operation.
Loading→SPEEDDHI→Doctor→Implantation→Empty Implanter→Loading
04 — Implant
One doctor or two doctors. One workflow.
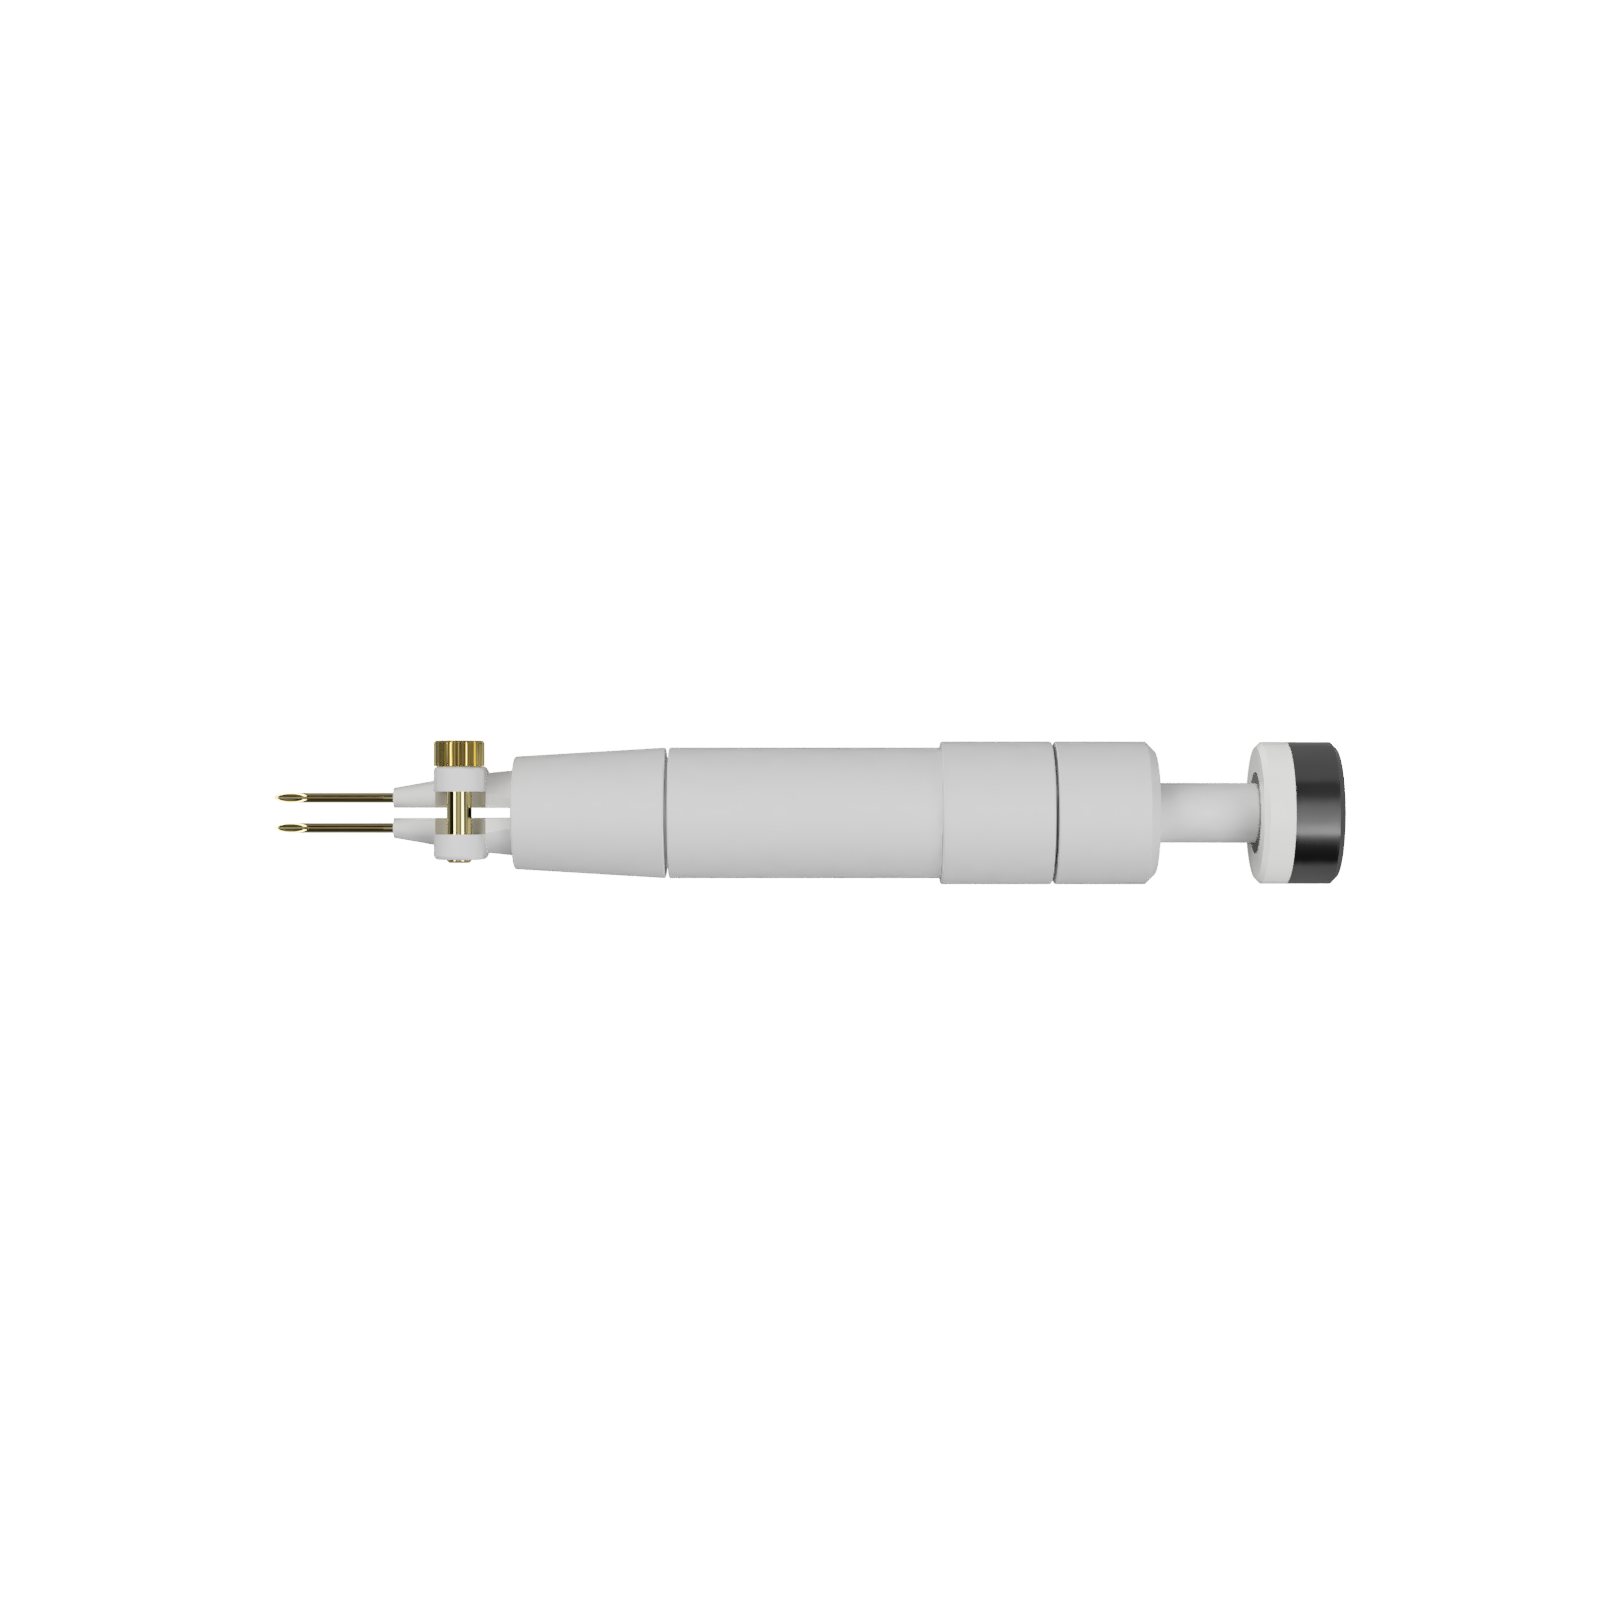
MultiPen™
SPEEDDHI Core™ and SPEEDDHI XL™ support single-doctor and dual-doctor working models. MultiPen™ is designed to create an organized and scalable workflow with multiple implanters.
MultiPen™ is positioned as a scalable technology that can support future 2, 3, and 4 implanter configurations.
Doctor A←SPEEDDHI→Doctor B
1 Doctor ✓2 Doctors ✓
05 — Track
See not only how many grafts are implanted,
but where they are implanted.
LiveCount™ + SmartTrack™ + Patient Display™
The doctor selects the active implantation region. Grafts counted by SPEEDDHI are transferred to the progress data of that active region. Planned, implanted, and remaining graft quantities can then be followed by region.
83%FRONTAL ZONE
COMPLETED
COMPLETED
| Region | Planned | Implanted | Remaining |
|---|---|---|---|
| Frontal | 1,500 | 1,250 | 250 |
| Mid-Scalp | 1,200 | 820 | 380 |
| Crown | 1,000 | 0 | 1,000 |
06 — Report
Operation data does not disappear when the case ends.
SmartReport™
Planning, graft counting, regional distribution, and duration data created during the operation can be brought together in one operation record at the end of the case.
SmartReport™ PDF Preview
- Patient information
- Doctor
- Clinic
- Date
- Total grafts
- Planned grafts
- Implanted grafts
- Regional distribution
- Operation duration
- Case summary